初衷与思路
想做在Hugo做一个类似Github那样的每日提交热度图,找到了一个很火的项目:
思路:使用rss的数据,即 [domain]/index.xml为数据源,使用纯JS前端做逻辑。
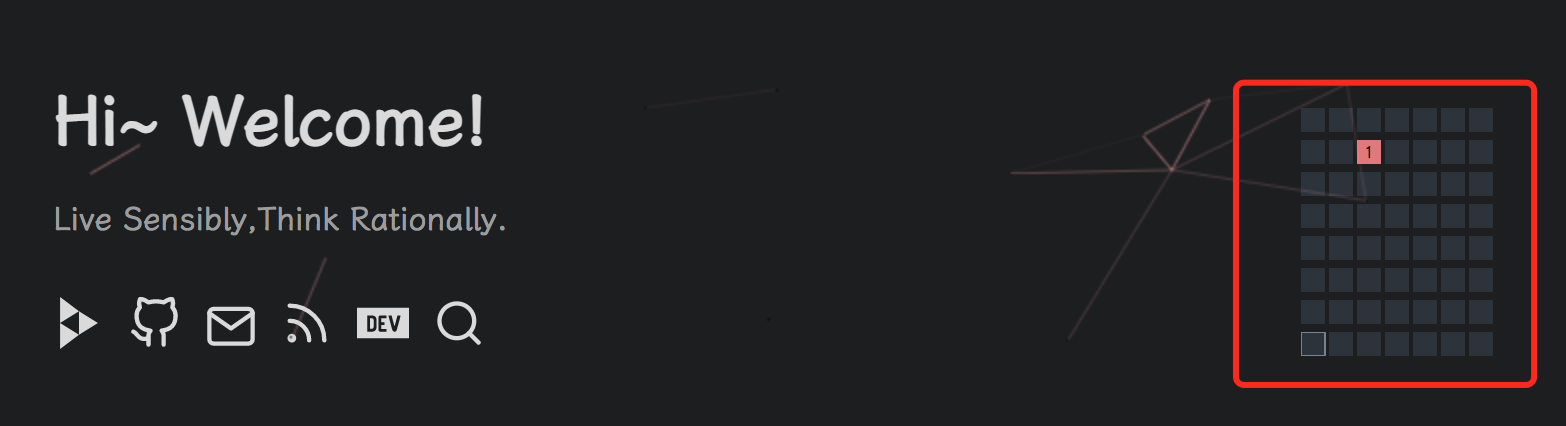
最终效果:
于是,开搞!
引入文件
在themes/xxx/layouts/partials/extend_head.html 尾部插入代码:
{{- if .IsHome }}
{{- /* cal-heatmap */}}

<script src="https://d3js.org/d3.v7.min.js"></script>

<script src="https://unpkg.com/cal-heatmap@4.0.0-beta.9/dist/cal-heatmap.min.js"></script>

<link rel="stylesheet" href="https://unpkg.com/cal-heatmap@4.0.0-beta.9/dist/cal-heatmap.css"></script>

{{/* tooltip */}}

<script src="https://unpkg.com/@popperjs/core@2"></script>

<script src="https://unpkg.com/tippy.js@6"></script>

{{- end }}
放在首页就做个IF判断,上部分是cal-heatmap依赖,下部分是鼠标移到小格子显示的tooltip依赖。
编写主文件
在static/js 新增主逻辑文件cal-heatmap.js,更新看本人的github项目
/*结果变量*/
const weekNum = 8;
const resultObj = {};
const resultList = [];

/*获取index.xml页面的数据*/

//补位0
function Appendzero(obj) {
  if (obj < 10) return "0" + "" + obj;
  else return obj;
}

if (window.XMLHttpRequest) {
  xhttp = new XMLHttpRequest();
} else {
  // IE 5/6
  xhttp = new ActiveXObject("Microsoft.XMLHTTP");
}

var localurl = "/index.xml"; //ssr地址
xhttp.overrideMimeType("text/xml");
xhttp.open("GET", localurl, false);
xhttp.send(null);
xmlDoc = xhttp.responseXML;

//遍历元素
var rootEle = xmlDoc.getElementsByTagName("channel")[0]["children"];
for (var key in rootEle) {
  var element = rootEle[key];
  if (element.nodeName == "item") {
    var child = element["children"];
    var title = child[0];
    var pubDate = child[2];
    if (pubDate.textContent == "" || title.textContent == "") {
      continue;
    }
    var date = new Date(pubDate.textContent);
    var dateFormat =
      date.getFullYear() +
      "-" +
      Appendzero(date.getMonth() + 1) +
      "-" +
      Appendzero(date.getDate());
    if (resultObj.hasOwnProperty(dateFormat)) {
      resultObj[dateFormat]["num"]++;
      resultObj[dateFormat]["postTitles"] += "," + title.textContent;
    } else {
      resultObj[dateFormat] = {};
      resultObj[dateFormat]["num"] = 1;
      resultObj[dateFormat]["postTitles"] = title.textContent;
    }
  }
}
//遍历obj,放入list
for (var key in resultObj) {
  var val = resultObj[key];
  var tmpJson = { date: key, value: val["num"], title: val["postTitles"] };
  resultList.push(tmpJson);
}
// console.log("HeatMap处理后的结果", resultList);

/*获取数据*/

//获取上几个星期的天
function getLastNWeeksDate(n) {
  const now = new Date();
  return new Date(now.getFullYear(), now.getMonth(), now.getDate() - 7 * n);
}
//获取这星期的周一
function getMonday(d) {
  d = new Date(d);
  var day = d.getDay(),
    diff = d.getDate() - day + (day == 0 ? -6 : 1); // adjust when day is sunday
  return new Date(d.setDate(diff));
}
var lastnweekday = getLastNWeeksDate(weekNum - 2);
var firstday = getMonday(lastnweekday);

const cal = new CalHeatmap();

//一年
// cal.paint({
//   theme: "dark",
//   domain: { type: "month" },
//   subDomain: { type: "day", label: "D", sort: "asc" },
// });

//一月
// cal.paint({
//   theme: "dark",
//   domain: {
//     type: "month",
//     label: {
//       text: null, //不显示标签
//     },
//   },
//   range: 1,
//   subDomain: { type: "day", label: "D", sort: "asc" },
// });

/*深色与明亮主题初始值判断*/
var isDark = document.body.className.includes("dark");
// console.log("是否深色主题", isDark);
var hlDate = new Date().toLocaleDateString();
var hlArr = hlDate.split('/');
var dateFormat = hlArr[0] + "-" + Appendzero(hlArr[1]) + "-" + Appendzero(hlArr[2]);
var realHLDate = new Date(dateFormat);

/* 参数 */
var options = {
  animationDuration: 200,
  theme: isDark ? "dark" : "light",
  verticalOrientation: true,
  date: {
    start: firstday, //开始时间为上8-2个周的周一
    highlight: [realHLDate],
    locale: { weekStart: 1 }, //周一为第一天
  },
  domain: {
    type: "week",
    label: {
      position: "right",
      text: null, //不显示标签
    },
  },
  range: weekNum,
  subDomain: {
    width: 12,
    height: 12,
    type: "day",
    // label: "D", //D是显示日期的日;null是不显示;回调函数是自定义
    label: function (timestamp, value) {
      return value;
    },
    sort: "asc",
  },
  data: {
    type: "json",
    source: resultList,
    x: "date",
    y: "value",
  },
  scale: {
    color: {
      range: ["#eea2a4", "#5c2223"], //[浅色,深色]
      interpolate: "hsl",
      type: "linear",
      domain: [0, 5], //文章数阈值:[min,max]
    },
  },
};

/*深色与明亮主题切换监听*/
document.getElementById("theme-toggle").addEventListener("click", () => {
  location.reload();// 由于没有重新渲染的函数,只能刷新界面
});

/*渲染*/
cal.paint(options);

/*初始点击的数据*/
let listObj = {}
function initClickUrls() {
  fetch("/index.xml")
    .then((res) => res.text())
    .then((str) => new window.DOMParser().parseFromString(str, "text/xml"))
    .then((data) => {
      let ls = data.querySelectorAll("channel item");
      listObj = {};
      ls.forEach(element => {
        let eleCollect = element.children;
        let dateStr = eleCollect.item(2).textContent;
        let url = eleCollect.item(3).textContent;
        let dateTs = Date.parse(dateStr);
        var date = new Date(dateTs);
        var ymd = date.getFullYear() + '-' + (date.getMonth() + 1) + '-' + date.getDate();
        if (listObj.hasOwnProperty(ymd)) {
          listObj[ymd]['url'].push(url);
        }
        else {
          listObj[ymd] = { 'date': ymd, 'url': [url] };
        }
      });
      console.log(listObj)
    });
}
initClickUrls();

//事件处理
cal.on("mouseover", (event, timestamp, value) => {
  var date = new Date(timestamp);
  var dateFormat = Appendzero(date.getMonth() + 1) + "/" + Appendzero(date.getDate());
  var str = '周' + '日一二三四五六'.charAt(new Date(timestamp).getDay());
  var tips = "";
  if (value == null) {
    tips = str + " " + dateFormat + " , 懒虫!";
  }
  else {
    tips = str + " " + dateFormat + " , " + value + " 篇";
  }
  tippy(event.target, {
    placement: "top",
    content: tips,
  });
});
cal.on('click', (event, timestamp, value) => {
  var date = new Date(timestamp);
  var ymd = date.getFullYear() + '-' + (date.getMonth() + 1) + '-' + date.getDate();
  var dateObj = listObj[ymd];
  if (dateObj) {
    var urlList = dateObj.url;
    if (urlList && urlList.length > 0) {
      var locationHref = urlList[Math.floor(Math.random() * urlList.length)];
      location.href = locationHref;
    }
  }
});
(可忽略) 在static/css 新增主逻辑文件footer-home.css,更新看本人的github项目
.first-entry {
    position: relative;
    display: flex;
    flex-direction: row;
    justify-content: space-between;
    align-items: center;
    min-height: 320px;
}

.cal-heatmap-container {
    display: flex;
    flex-direction: row;
    justify-content: flex-end;
    align-items: center;
    width: max-content;
}
引入主文件
在themes/xxx/layouts/partials/extend_footer.html 尾部插入代码:
{{- if .IsHome }}
{{- /* cal-heatmap */ -}}
<script type="text/javascript" src="js/cal-heatmap.js"></script>
<link rel="stylesheet" href="css/footer-home.css">
{{- end }}
大功告成~ 如有疑问可留言!
后续问题
- dark/light主题切换问题
- tooltip显示
- 点击日期进入相关post页面